
We read your org
Code Analyzer runs across your custom Apex and your Flow automation, mapping what is there and how it actually executes at runtime.
Before you commit
Real findings from a real review.
Sample outputs are on the page, no form in the way.
How it works
Code Analyzer runs across your custom Apex and your Flow automation, mapping what is there and how it actually executes at runtime.
Findings counted by category, engineering pillars measured, and the risks that matter, each one explained rather than scored and left at that.
Every finding becomes a ranked action with a reason attached, so you know what to fix first and what can wait.
A sample of what comes back
A real review, sanitized. Client names and connection details are stripped out. The findings are what Code Analyzer returned. The trigger map is an example of that output rather than a client’s own.
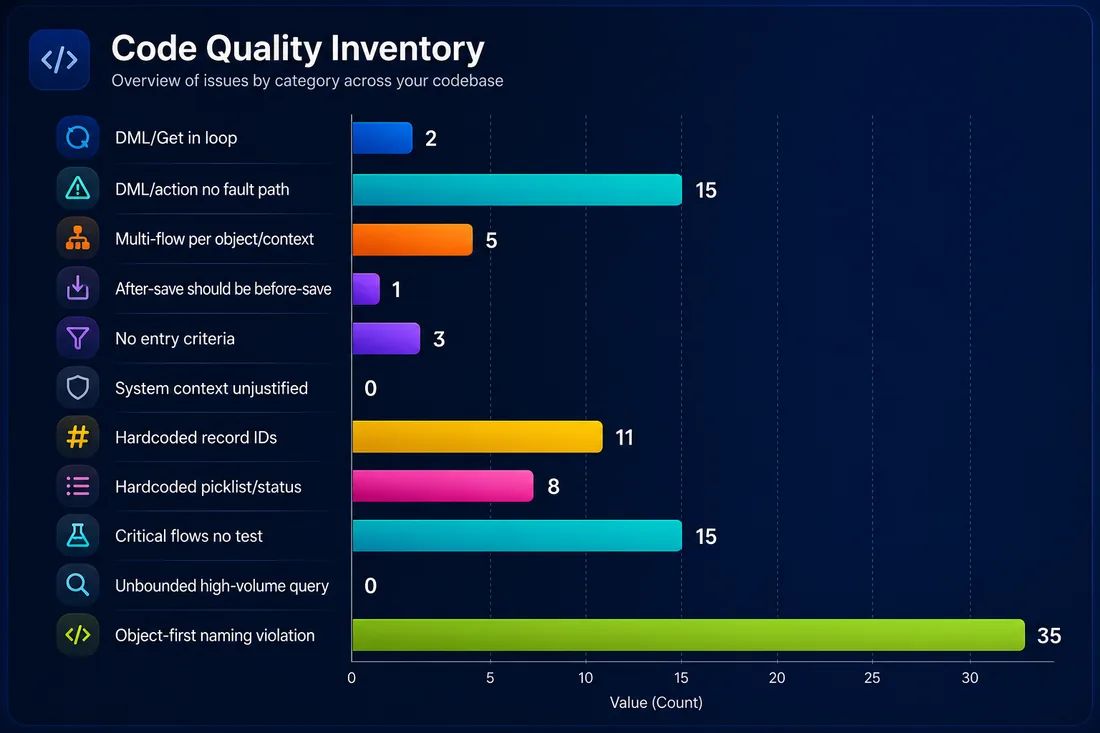
Code Quality Inventory provides a categorized view of the issues identified across your codebase, making it easy to understand where technical debt exists and what should be prioritized. The inventory includes findings across objects, Apex classes, SOQL queries, test classes, and other code quality categories, giving engineering teams a clear, actionable view of the health of their codebase so remediation can be prioritized based on risk and business impact.
From this review
Every custom class and trigger checked against eleven rules. This org came back with 26 findings, led by 13 classes with no exception handling.
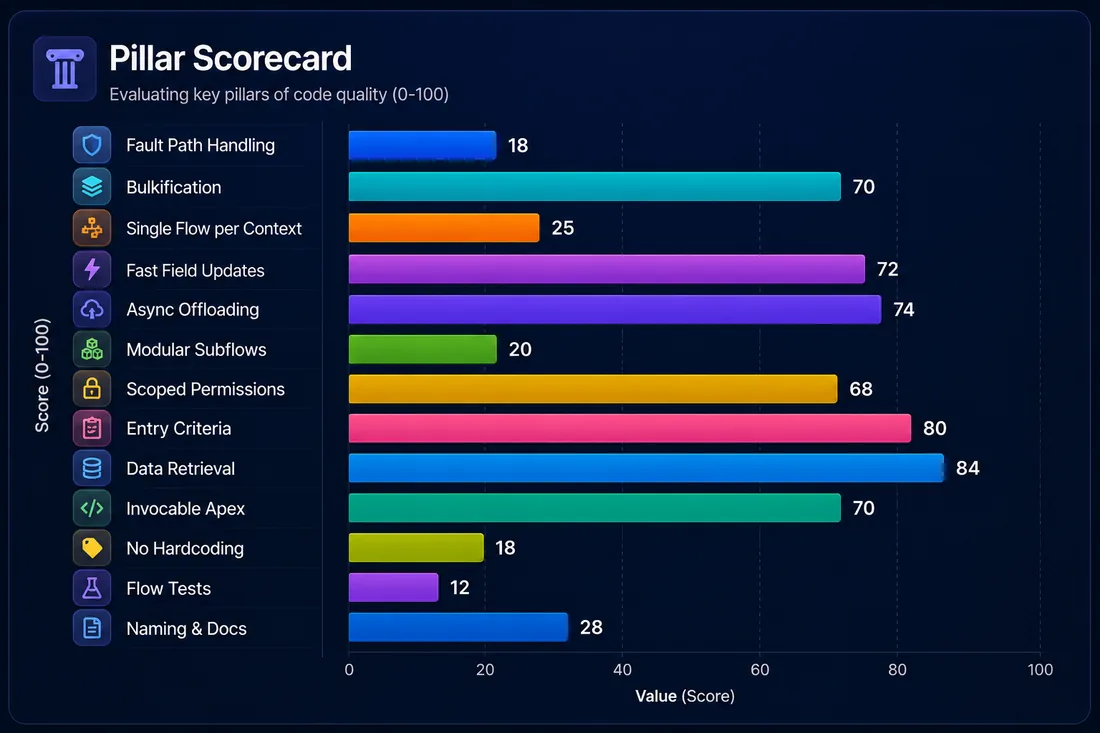
Architectural Pillars provide a score across the core dimensions of your Salesforce architecture, offering a clear view of the overall health of your environment. Each pillar is scored on a scale from 0 to 100, where higher scores indicate stronger architectural maturity and lower scores highlight areas requiring attention. This allows engineering teams to quickly identify architectural weaknesses, prioritize improvements, and focus modernization efforts where they will have the greatest impact.
From this review
Thirteen engineering pillars scored against what good looks like. In this org, fault path handling came back at 18 and flow tests at 12, which is where the work starts.
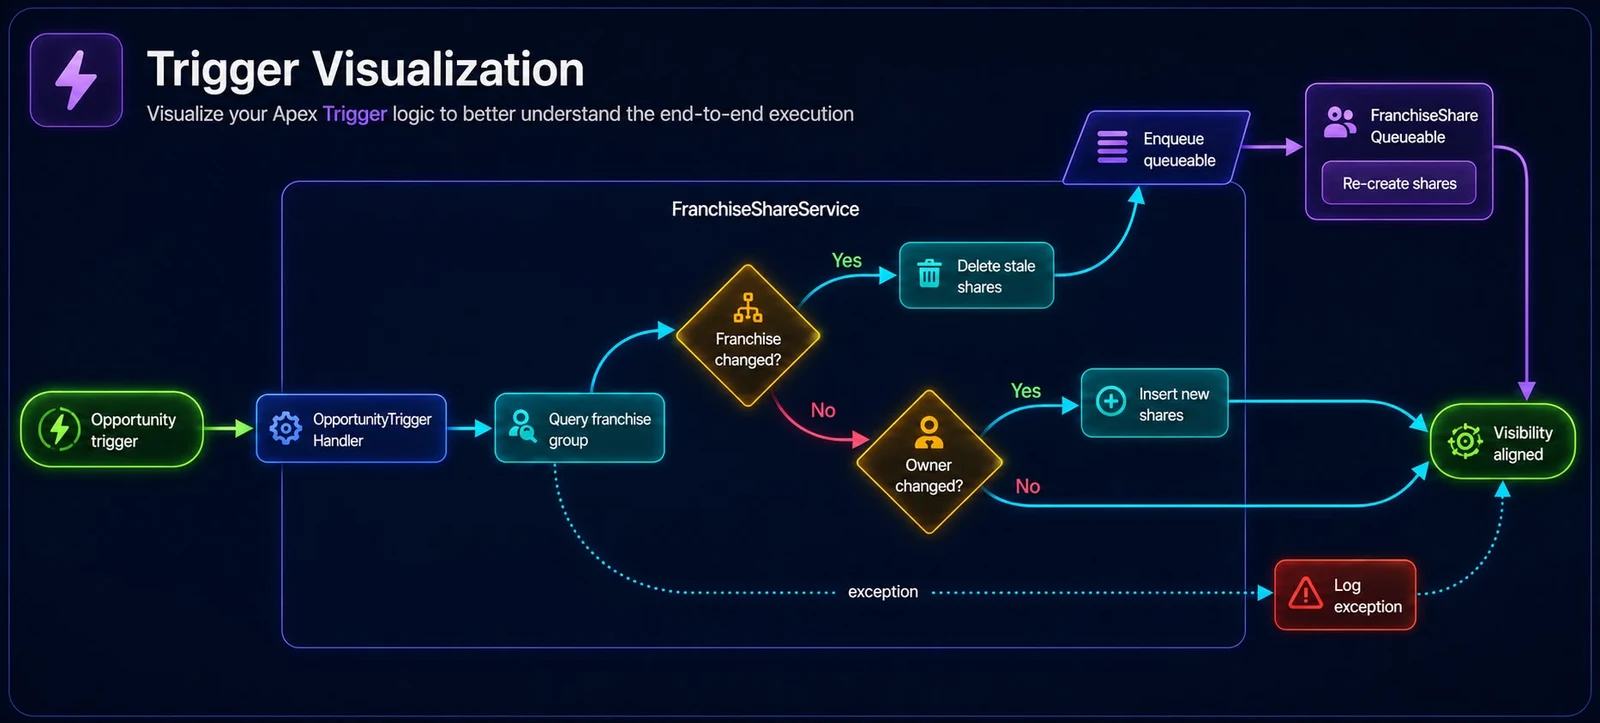
Trigger Visualization automatically generates a visual map of your Apex trigger logic, making it easy to understand the end-to-end execution flow. By illustrating the relationships and sequence of operations within a trigger, engineering teams can quickly navigate complex logic, identify dependencies, and gain a clearer understanding of how automation is executed across the codebase.
What it shows
One Opportunity trigger, mapped end to end: a handler, a query, a service class with two conditional branches, an async job that re-creates share records, and a separate path for exceptions. None of that chain shows up in a config export.
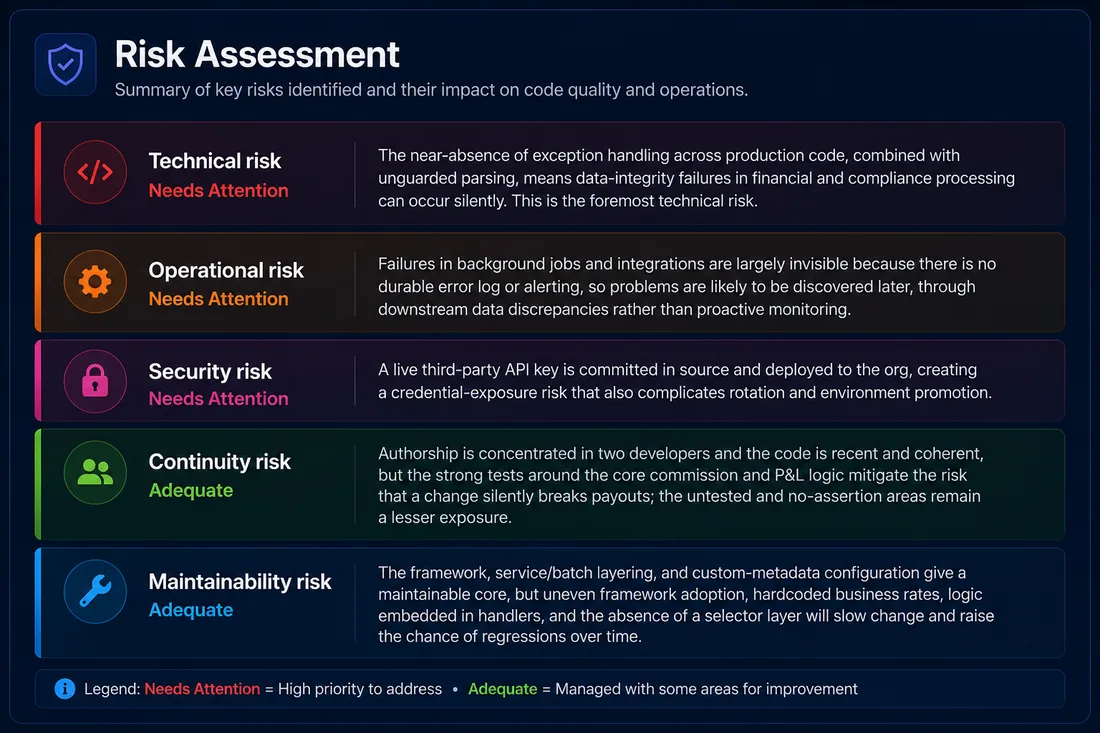
Risk Assessment provides a consolidated view of the technical, operational, and security risks identified across your Salesforce environment. By evaluating the health of key architectural dimensions, it highlights areas where technical debt may increase complexity, reduce reliability, or impact long-term maintainability. This enables engineering teams to understand overall platform risk and prioritize remediation efforts based on business impact.
From this review
Technical, operational, security, continuity, and maintainability, each rated and explained in plain language. This review caught a live API key committed in source.
Three fields and it is yours right now. The full sample Architecture Intelligence Review, including the outputs above, with no call required.
It’s a look at what’s actually going on under the hood of your org. Code Analyzer scans your custom Apex and Flow automation and shows you what’s really there: the technical debt, the security gaps, whatever’s standing between you and AI. You get every finding back ranked, with the reasoning behind it. We call ours the Architecture Intelligence Review.
Nothing. Sample outputs from a real, sanitized review are right on this page, no form required, and if you want the full sample sent over, just tell us where. Either way, no call needed.
Book a free assessment and we’ll scope it together. From there, Code Analyzer runs across your custom Apex and Flow automation, mapping out what’s there and how it actually behaves at runtime. You get every finding back ranked, with the reasoning attached.
No, it reads your code and automation, it doesn’t touch either one. What you get back is a prioritized set of findings and recommendations, not a set of edits made for you.